Occupancy Is Not a Diagnosis: Reading NHS Winter Flow Data in 2026
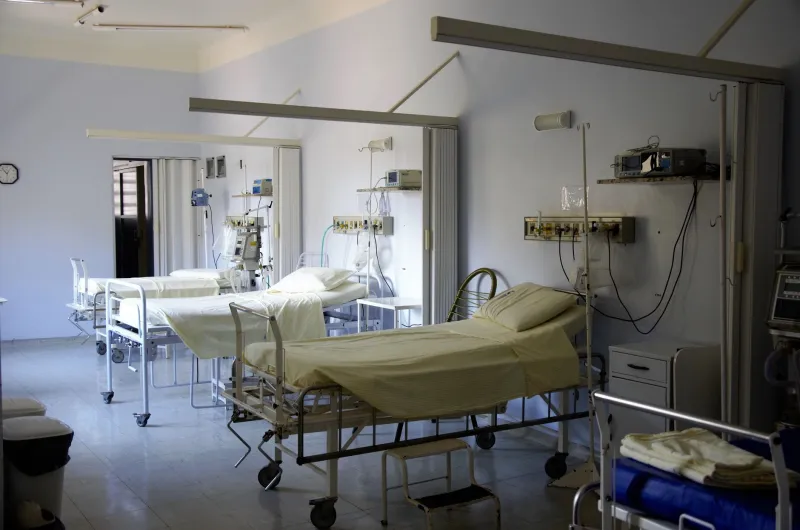
Every winter, the same ritual returns. A hospital trust reports that its beds are full, a regional news bulletin describes corridors as wards, and a national figure is distilled into a single percentage. The number is real, but it is not self-explanatory. Hospital flow data are produced to help managers move patients, staff and resources through a system under strain. They are not designed to answer every question the public wants to ask about care.
That distinction matters more than ever as winter 2026 approaches. Bed occupancy, discharge delays and elective cancellations are likely to dominate health coverage in the coming months. Read too quickly, they can suggest a simple story of too many patients and too few beds. Read properly, they reveal a more complicated picture of definitions, denominators and decisions.
What hospital flow data actually count
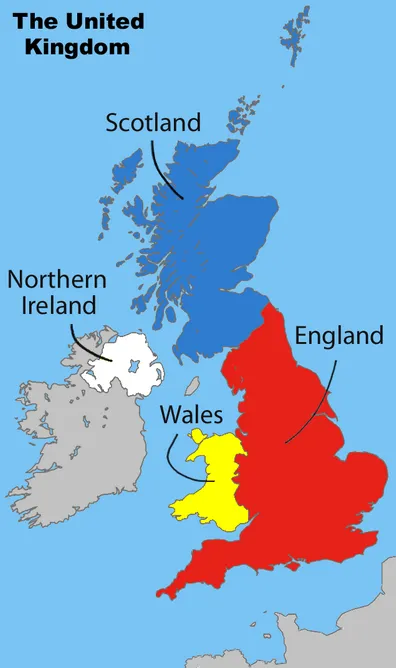
Most NHS winter reporting draws on routinely collected operational data. In England, daily situation reports and related collections capture how many beds are available, how many are occupied, how many patients are waiting for discharge and how many emergency departments are under pressure. Scotland, Wales and Northern Ireland run their own systems, with different definitions and publication rhythms. Even within England, a trust-level figure may not match a specialty-level figure because the boundaries of the count are different.
The basic occupancy measure looks straightforward: occupied beds divided by available beds. But both parts move. A ward may open escalation beds, close beds for infection control or convert day space into short-stay capacity. Staffing shortages can make a physically available bed unavailable in practice. A trust may report high occupancy while also reporting that some beds are closed. The percentage is therefore a snapshot of a changing system, not a fixed property of a hospital.
The 100 per cent illusion
A headline that says a hospital is 100 per cent occupied sounds like a complete description. It is not. Occupancy can vary by time of day, by day of week and by patient group. A midnight count may miss the afternoon peak in emergency admissions. An average across a month may smooth away the difficult weekends. A trust-wide figure may conceal a struggling specialty, such as paediatrics or critical care, behind a calmer overall position.
The denominator is just as important. Occupancy is high partly because the bed base has changed over time. Comparing today's percentage with a figure from a decade ago can mislead if the number of staffed beds has fallen, if community capacity has shifted or if the mix of patients is different. A high percentage in a small hospital with a narrow case mix is not the same as a high percentage in a large teaching hospital with complex cases. The single figure hides the texture of pressure.
Discharge delays are not a single problem
Delayed discharge data are often treated as a proxy for social care failure. There is truth in that, but only part of it. Patients may remain in hospital because a care package is not ready, because a residential placement is unavailable, because housing needs cannot be met or because a family is waiting for support. They may also be delayed while further clinical assessment takes place. The reasons are recorded in categories, and those categories matter.
A rise in delayed discharges can reflect better identification as much as worse performance. If clinicians are asked to record whether a patient no longer meets the criteria to reside, the count may increase simply because the question is being asked more consistently. That does not mean the pressure is imaginary. It means the number needs to be read alongside its definition. Operational data are digitised records of a process, not a moral ledger.
Elective cancellations and the seesaw
Elective cancellations are another winter signal that is easy to misread. A cancellation may be due to emergency pressure, staffing, equipment, infection control or a patient's own decision. National collections distinguish between these reasons, but headlines often do not. A trust that cancels planned surgery to protect emergency capacity is making a visible trade-off. A trust that postpones a clinic appointment is making a different one. Combining them into a single measure of 'winter pressure' can obscure where the strain actually falls.
The seesaw between emergency and elective care is real. When beds fill, planned admissions are often the first to be postponed. But the effect is not evenly distributed. Patients waiting for joint replacements, cataract surgery or diagnostic procedures may experience delays that accumulate quietly, well beyond the winter months. Flow data can show the immediate trade-off. They cannot, on their own, show the long-term health consequence.
Geography and the limits of comparison
The UK does not have one hospital flow dataset. NHS England, NHS Scotland, NHS Wales and Health and Social Care in Northern Ireland collect and publish information differently. Bed definitions, reporting periods and the treatment of community beds can vary. Comparisons across nations are possible, but they require care. A figure that looks like a like-for-like comparison may be measuring different things.
Even within one nation, local context matters. Rural hospitals face different travel and discharge pressures from urban trusts. Areas with older populations may have different bed use. Areas with fragile social care markets may see delays earlier. The data can point to where to look, but they cannot explain the local system without local knowledge.
How to read a winter flow story
When a hospital flow figure appears in the news, four questions are worth asking. What exactly is being counted? Over what period? What is the denominator? And what is happening around the number? A trust reporting full beds may also be reporting high flu admissions, a norovirus outbreak or a shortage of care home places. Those details change the interpretation.
It is also worth distinguishing between pressure and harm. High occupancy is a sign of strain, but it does not automatically mean that every patient receives poor care. Similarly, a lower occupancy figure does not guarantee safety if staffing is thin or if patients are being cared for in inappropriate spaces. Data are a smoke alarm, not a diagnosis.
The bed board never lies, but it does not tell the whole truth either. It records what the system is doing at a particular moment. Winter 2026 will produce many such moments. The task for readers is not to dismiss the numbers, nor to treat them as a complete story, but to ask what they were collected to show and what they leave out.