The Unit and the Patient: Reading NHS Dental Access Data Beyond the Headlines
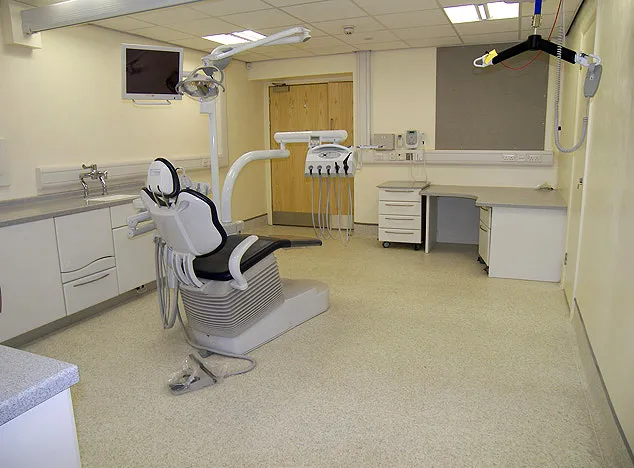
Photo: Walter Baxter, CC BY-SA 2.0, via Wikimedia Commons
Every few months a version of the same headline appears: NHS dentistry is disappearing. The claim is usually anchored to a number — a percentage of adults seen in the past two years, a count of practices handing back contracts, a survey of people who say they cannot get an appointment. These are legitimate indicators, but they are not the same indicator, and treating them as interchangeable produces a picture that is sharper and simpler than the underlying record.
What is actually counted
Most NHS dental activity in England is recorded through the FP17 form, the claim a practice submits after a course of treatment. The claim is not a description of a tooth; it is a billing document. It records the treatment band, whether the patient is exempt from charges, and the number of Units of Dental Activity (UDAs) the course attracts. A Band 1 course — examination, diagnosis, perhaps a scale and polish — is typically one UDA. Band 2 courses, which include fillings and extractions, are weighted at three. Band 3, for crowns, bridges and dentures, is weighted at twelve. Urgent courses carry a smaller tariff.
The UDA is therefore a currency, not a clock. It does not measure how long a dentist spent, how difficult the case was, or whether the outcome was good. It measures the contractual value of a completed course of treatment. That distinction matters because the NHS dental contract, introduced in its current form in 2006, pays practices largely by UDA rather than by patient or by hour. When commentators say a practice is "underperforming", they usually mean it delivered fewer UDAs than its contract specified. That is an administrative fact, not a clinical one.
Access is a rolling window, not a register
England does not have a national dental list in the way it has a GP list. The standard access measure — the proportion of adults seen by an NHS dentist in the previous 24 months — is derived from FP17 claims, not from registration. It is a rolling count of people who have had at least one course of treatment. A person who has not tried to book in three years is invisible to it. So is a person who called, was told there were no appointments, and did not call again. The measure captures use, not need, and not even the full extent of demand.
Children are counted on a different cycle, usually 12 months, and urgent care is counted separately again. A practice can appear to have high access while offering little routine care, or low access while providing a large volume of urgent treatment. The figures are not wrong; they answer different questions.
Where the variation comes from
Regional variation in dental access is real, but it is not a single gradient. It is produced by several overlapping mechanisms. Workforce is the most obvious: practices in coastal, rural and former industrial areas have found it harder to recruit and retain dentists, and the distribution of training places and associate contracts has reinforced that pattern. Contract value per UDA varies too. A practice paid a lower rate per UDA has less headroom to absorb rising costs, and may hand back part of its contract or reduce its NHS commitment. Commissioning adds another layer: integrated care boards inherit contracts of different sizes and ages, and their ability to reshape services depends on local negotiation and on the availability of capital.
Patient charges and exemptions also shape what gets recorded. Around half of NHS dental patients are exempt from charges, and the band structure means that a patient who needs a crown may face a substantial co-payment. Some people delay treatment; some seek urgent care instead; some leave the NHS system altogether. Each of these choices leaves a different trace in the data.
What the data cannot say
The most important limitation is that activity data says nothing about disease. A practice can deliver its full UDA allocation while seeing a patient group with high levels of untreated decay. Conversely, a practice that delivers fewer UDAs may be concentrating on prevention or on complex cases that take longer than the tariff assumes. To understand need, researchers use separate sources: the National Dental Epidemiology Programme's surveys of children's teeth, hospital admission data for dental extractions under general anaesthetic, and local oral health needs assessments. These are slower and less frequent than contract data, and they do not align neatly with it.
There is also the question of quality. The UDA system rewards completed courses, not necessarily the right ones. A filling that fails within a year still counts. A preventive conversation that avoids a filling does not count at all. This is a known weakness of activity-based commissioning, and it is one reason contract reform has been debated for more than a decade.
Reading the numbers in 2026
When a dental access figure is published in 2026, three questions are worth asking. First, what is the denominator? Adults over 18, children, or all courses of treatment? Second, what is the time window? A 24-month rolling measure and a 12-month measure will tell different stories about the same population. Third, what is the unit? UDAs, courses of treatment, patients seen, or practices holding a contract? Each unit implies a different model of what dentistry is for.
None of this means the figures are unusable. It means they are a ledger, and ledgers need to be read as ledgers. The headline about disappearing dentists is not false, but it compresses a complex administrative record into a moral verdict. A missing tooth is a clinical event. A missing UDA is a contractual one. The two are related, but they are not the same, and the gap between them is where most of the argument actually lives.