Counting Absence, Missing Cause: What NHS No-Show Records Actually Measure
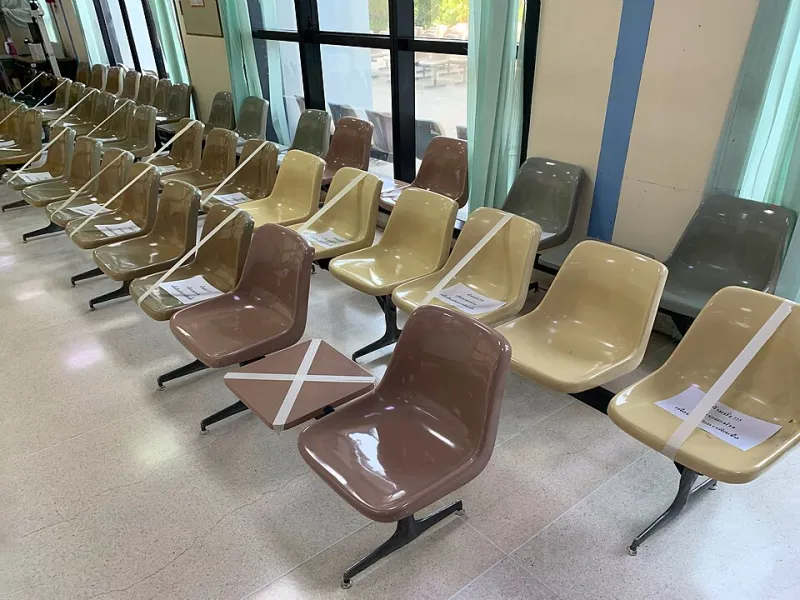
Photo: Chainwit., CC BY-SA 4.0, via Wikimedia Commons
An empty appointment slot is a small event in a single clinic. Multiplied across general practice, community services and hospital outpatient departments, it becomes a statistic that attracts attention from managers, policymakers and the press. In 2026, missed appointments are often discussed in the language of waste and behaviour: the slot that was not used, the patient who did not turn up. That framing is understandable, but it mistakes an operational record for a diagnosis of cause. The digitised trail left by a missed appointment can tell us that a gap occurred. It cannot, on its own, tell us why.
An administrative trace, not a clinical finding
Whenever an appointment is booked, a patient record carries a status. 'Did not attend' is one possible code. It is a local administrative entry before it is a national statistic. The same event may be recorded differently across settings. General practice, dentistry, community clinics and hospital outpatient services use different systems and different rules. Some services record 'was not brought' for children; others use 'did not attend'. Some capture a reason; many do not.
Digitisation has made these records easier to aggregate. It has not made them self-explanatory. A no-show count is an event count, not a person count: one patient with repeated appointments can generate many records. The data may include appointments that were never confirmed, slots that were changed at short notice, or patients who tried to cancel but could not get through. Without linkage to booking and cancellation logs, the label is thinner than it looks.
What the rate can and cannot prove
A no-show rate is a fraction: missed appointments divided by booked appointments. Both parts matter. A service with long waiting times may see more no-shows because circumstances change between booking and appointment. A service with easy online cancellation may record fewer missed appointments simply because patients can free the slot in advance. A low rate is not automatically a sign of good access; a high rate is not automatically a sign of apathy.
Comparisons across specialties, providers and regions need case-mix adjustment. A diabetes clinic and a dermatology clinic do not serve identical populations or appointment patterns. The data can show patterns: higher rates among younger adults, in certain specialties, in areas of higher deprivation, or at sites with poorer transport links. These are associations. They are prompts for investigation, not proof of individual motive.
The access layer beneath the absence
Consider a patient who relies on two buses to reach a hospital site. A journey that looks reasonable on a map can become fragile when a connection is missed, a bus is cancelled or a return journey is uncertain. If the appointment letter arrives late, or the reminder goes only to a smartphone app, the slot may be lost before the day begins. Consider a parent with caring responsibilities and no flexible childcare, or a shift worker who cannot take unpaid time off. Consider someone with limited digital access who cannot use online triage or respond to a text message. None of these circumstances is captured by the code alone.
Digital exclusion deserves particular attention in 2026. The NHS App and online booking have widened convenience for many patients, but they have also changed the route by which appointments are confirmed, rescheduled and cancelled. A patient who cannot use those routes may appear in the data as a no-show even when they attempted to engage. The same is true of language barriers, cognitive impairment and unstable housing.
Why 'could not attend' is not a softer label
Some services have experimented with 'could not attend' or 'was not brought' categories. These are not merely semantic. 'Was not brought' can be a safeguarding signal for a child or dependent adult. 'Could not attend' can capture transport failure or a sudden caring crisis. But reason codes are only useful if staff have time to record them and if the categories are used consistently. A richer code set does not remove the need for careful interpretation.
Reading no-shows as a map of friction
Public-health analysis can add context without pretending to explain every case. Linking appointment records to area-level data on deprivation, public transport accessibility and digital exclusion can identify where missed appointments cluster. It can help a trust decide where to place a transport service, extend cancellation lines, or offer flexible clinics. It can also show where a high no-show rate is a symptom of a booking process that is hard to navigate.
Such linkage must respect privacy and data governance. The aim is not to build a profile of the unreliable patient, but to understand the friction in the system. Aggregate analysis can reveal patterns; individual records should remain clinical and confidential.
A more honest question
The important question is not simply how many patients missed appointments. It is which appointments were missed, by whom, in what circumstances, and whether the health system made attendance unnecessarily difficult. A no-show record is a thin piece of evidence. Read alongside booking logs, cancellation data and local context, it becomes more useful. Read alone, it risks turning a failure of access into a failure of character.
Missed appointments are real. They consume capacity and can delay care for others. But the statistic that counts them is not a verdict on patients. It is a prompt to ask what happened before the slot was left empty. In a digitised health service, that is the more demanding—and more useful—question.