Counting Resistance: How One Urine Sample Becomes a National AMR Statistic
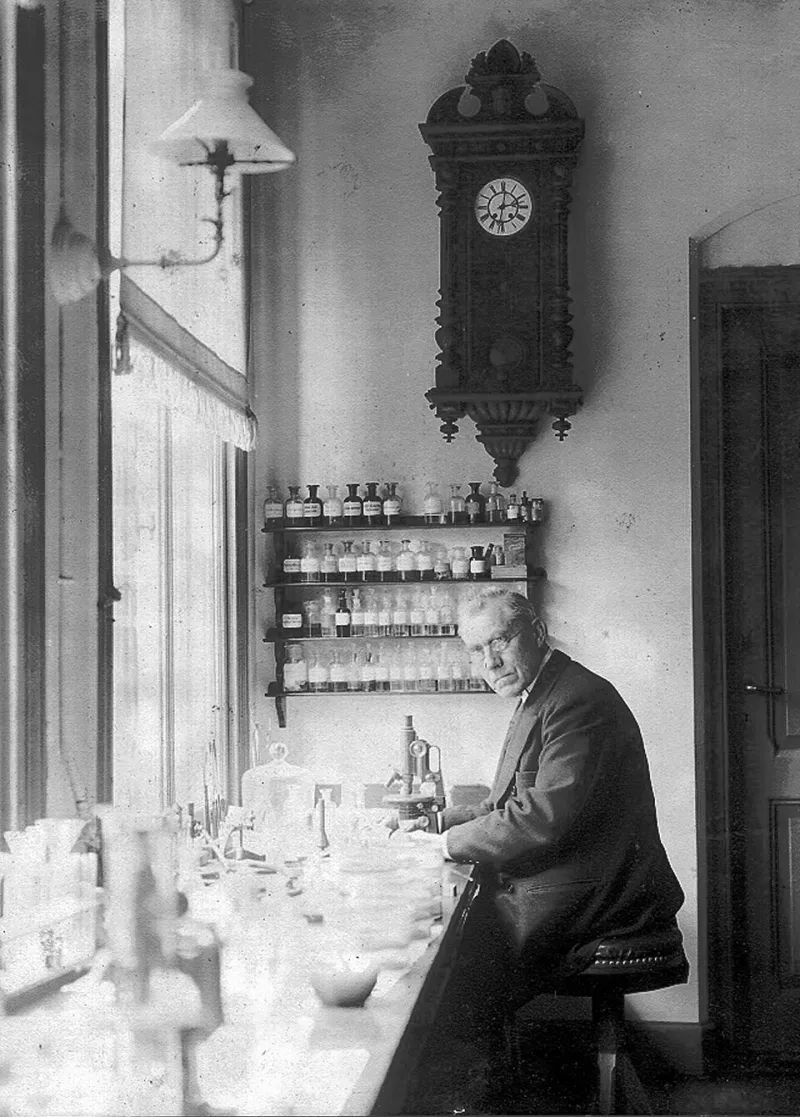
Photo: Unknown authorUnknown author, Public domain, via Wikimedia Commons
Antimicrobial resistance is often reported as a simple movement: a percentage up, a percentage down, a warning that Britain is losing the drugs on which modern medicine depends. The warning may be sound, but the percentage is not a direct reading of danger in the population. It is the end point of a long chain of clinical decisions, laboratory methods and data processing. Understanding that chain is the difference between noticing a signal and overreading it.
A sample begins as a question, not a statistic
Consider a patient who contacts a GP surgery with symptoms of a urinary tract infection. The clinician may send a urine sample to a local microbiology laboratory. The sample is cultured, organisms are identified, and, where appropriate, the laboratory tests susceptibility to a panel of antibiotics. The result may be reported as susceptible, resistant or intermediate according to current breakpoints, with a minimum inhibitory concentration where that is available.
Only at this stage does a clinical episode begin to look like data. The laboratory assigns codes for the organism and the susceptibility result, and the record is transmitted through the laboratory information system. But the sample has already been filtered. It came from someone who sought care, whose clinician decided to test, and whose specimen grew an organism that the laboratory considered worth reporting. A negative culture, a contaminated specimen, a patient who was not tested, or an infection managed without microbiology all sit outside the resistance percentage.
That filtering is not a flaw in the system. It is how laboratory surveillance works. The difficulty begins when a figure produced from tested isolates is read as though it described all infections, or all patients, or all prescribing.
From the bench to the dashboard
In the UK, local laboratory results feed national surveillance through electronic reporting systems and collated datasets. Public health bodies, including the UK Health Security Agency, publish analyses of antimicrobial resistance and antimicrobial prescribing. These outputs draw on specimen types such as urine and blood, and on organism groups such as Escherichia coli or Klebsiella pneumoniae. The exact composition of each indicator matters. A resistance percentage for bloodstream infections is not interchangeable with one for urinary isolates, and a figure covering all ages and settings is not the same as one restricted to intensive care.
Between the laboratory and the published chart, further decisions are made. Records are deduplicated. Specimen types are classified. Organisms are grouped. Some analyses count only the first isolate per patient in a period; others may handle repeats differently. Laboratories vary in testing panels and in how readily they report certain resistances. A national dashboard can harmonise much of this variation, but it cannot abolish it.
This is why the same broad claim – that resistance is rising – can rest on quite different underlying patterns. An increase may reflect a genuine change in the organisms causing infections. It may also reflect changes in who is being tested, where testing happens, which specimens are sent, or how laboratories classify and report results. None of these possibilities is mutually exclusive.
What the denominator is doing
The denominator in an AMR percentage is usually the number of tested isolates, not the number of infections in the community. That distinction is central. If testing expands to include milder cases, the mix of isolates can change. If a hospital sends more blood cultures during a period of heightened vigilance, the denominator shifts. If a particular organism is under-sampled in primary care, its national profile may depend disproportionately on hospital laboratories, where patients are often sicker and more heavily exposed to antibiotics.
Sampling bias therefore runs through AMR surveillance in several directions. Community and hospital populations differ. Urine and blood specimens differ. Repeat samples from a patient with a long-running infection can weight the dataset if not handled carefully. Private laboratories and NHS laboratories may not contribute in identical ways. Even the decision to use a particular breakpoint can move an isolate between categories without any change in the organism itself.
A resistance percentage is best understood as a property of a surveillance system as well as a property of the organisms it detects. That does not make it useless. It makes it a particular kind of evidence.
Reading a 2026 headline without overreading it
When a headline reports that resistance to a named antibiotic has risen, the first questions should be concrete. Which organism is involved? Which specimen type? Which part of the UK, and which care setting? Over what period, and compared with what baseline? How many isolates are behind the percentage, and how much has testing changed? Is the movement part of a sustained trend or a one-year fluctuation? Are confidence intervals available, and do they overlap with the previous figure?
These questions are not pedantry. They determine whether a reported rise should prompt a national review of prescribing, a local infection-control investigation, a change in laboratory testing, or simply continued monitoring. A rise concentrated in one region or one hospital may say more about local case mix and outbreak activity than about Britain as a whole. A stable national figure may conceal divergent trends in different settings.
AMR data can also be misread in the other direction. A fall in resistance is not proof that stewardship has succeeded, and a rise is not proof that prescribing has worsened. Prescribing data and resistance data are related, but the relationship is mediated by infection control, travel, population health, healthcare contact and time. Surveillance can show that a problem is changing; it rarely, by itself, explains why.
What the dataset can and cannot carry
Used carefully, digitised microbiology supports trend monitoring, local and national comparison, outbreak detection, research and the targeting of antimicrobial stewardship. It helps hospitals and health systems ask better questions. It cannot tell a reader the risk to any individual patient, the total burden of resistance in the community, or the quality of prescribing in a single practice. It cannot see infections that were never cultured, and it cannot fully standardise every laboratory in the country.
The dose in the dataset is real, but it is a measured dose. A national AMR percentage is a sentinel, not a verdict. It deserves attention precisely because it is produced by a system that sees only part of the picture – and because that part, read with its denominators and its gaps in view, can still tell Britain something important about the infections it faces in 2026.