Reading a Postcode Like a Clinician: What Small-Area Health Data Can and Cannot Tell You
Photo: Secretlondon, CC BY-SA 4.0, via Wikimedia Commons
Every few months another interactive map appears, shading the country in amber and deep red and inviting readers to type in their own postcode. The Office for Health Improvement and Disparities (OHID) publishes its Fingertips profiles; the Office for National Statistics (ONS) offers local area tools built on Census 2021; NHS England and the integrated care boards publish inequalities dashboards; local authorities publish joint strategic needs assessments. The volume of neighbourhood-level health data available to the public in 2026 is unprecedented. So is the scope for misreading it.
The purpose of this guide is not to discourage that curiosity. Area-level data are among the most useful tools in public health, and citizens who interrogate them are doing something valuable. It is, rather, to set out the technical habits that trained analysts apply automatically, and which everybody else can learn in an afternoon.
A postcode is an address, not an explanation
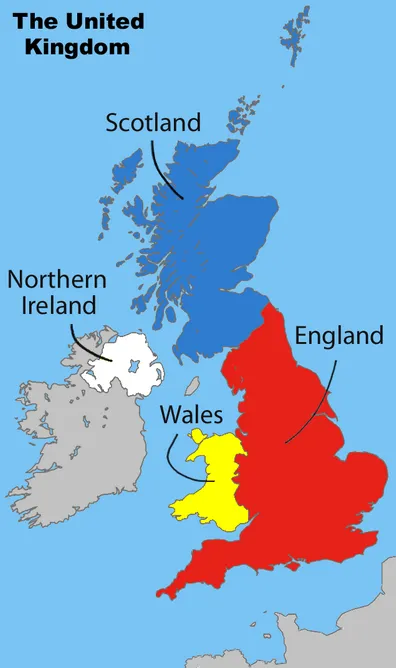
The first thing to establish is what geography you are actually looking at. Most English small-area statistics are published for Lower Layer Super Output Areas (LSOAs), statistical units of roughly 1,500 residents or 650 households, of which there are about 33,000 across England. Above them sit Middle Layer Super Output Areas (MSOAs), wards, local authorities and integrated care boards. Scotland, Wales and Northern Ireland maintain equivalent but distinct geographies.
These boundaries are revised after each census. Indicators published on 2011 boundaries sit alongside indicators published on 2021 boundaries, and combining them requires careful look-up files. A number attached to a place name is therefore a statement about a polygon drawn at a particular moment, containing a population that has since moved, aged and changed tenure. Postcodes themselves are not health geographies at all; they are postal routing artefacts, redrawn when a new housing estate is built.
Small numbers have large error bars
An LSOA is a small place. A rate calculated from nine events in a year is not a stable measurement; it is a sample from a process we cannot see, and the confidence interval around it will often be three or four times wider than the estimate itself. Two adjacent neighbourhoods may show a threefold difference in a disease rate purely because one recorded twelve cases and the other four.
Three practical defences follow. First, look for the confidence interval whenever it is published, and treat overlapping intervals as an absence of evidence for a difference rather than a fine distinction. Second, prefer indicators pooled over three years, which most national producers now offer. Third, treat year-on-year movement in a small area with suspicion: a rise from three to six is a doubling in the table and a rounding error in reality. Suppression and disclosure-control rules — counts below five or ten withheld or rounded — add a further layer of uncertainty that the map itself rarely advertises.
Denominators are the weakest link
Much of the most-quoted local data comes from general practice. Quality and Outcomes Framework (QOF) prevalence figures, for instance, divide the number of patients on a practice's disease register by the size of that practice's registered list. Neither number is a population count. Lists include students, commuters and people who have moved but not re-registered; they exclude residents who are registered elsewhere or not at all. In areas of rapid housebuilding or high population turnover, list inflation can depress recorded prevalence, while list validation exercises can raise it overnight without a single extra diagnosis.
Registration geography also cuts across statistical geography. Patients do not necessarily live near their surgery, and the postcode held on the practice record may be years out of date. When a practice-level figure is mapped onto a neighbourhood, those mismatches travel with it.
Age, deprivation and the ecological fallacy
Crude rates are dominated by age structure. A coastal district with a large retired population will record more heart failure than a university city, and that difference may say more about demography than about risk. Age-standardised rates exist precisely to correct this, but they are not always the figure quoted in a news report.
Deprivation is the other great confounder. The Index of Multiple Deprivation, and its successors, combine income, employment, education, health, crime, housing barriers and living environment into a single LSOA-level score. It correlates strongly with disease prevalence, but it is not a verdict. Some deprived areas have well-organised primary care and good uptake; some affluent ones have high levels of undetected risk. Most importantly, area averages say nothing reliable about any individual living within them — the ecological fallacy is the most common error in public readings of health maps.
Prevalence is not the same as need
Recorded prevalence reflects incidence, duration and detection. An area with unusually high recorded hypertension may have more disease, or better case-finding; one with low recorded prevalence may be healthier, or may simply see its GP less often. Similarly, a low rate of emergency admissions can signal good community care or can conceal unmet need.
It helps to separate four things that dashboards often blur: need (who is unwell), demand (who presents), activity (what the service did) and outcome (what happened). A figure that appears to describe the first may in fact describe the third.
Questions to ask before drawing a conclusion
- What geography is this, and when were its boundaries fixed?
- Is it a count, a crude rate or an age-standardised rate, and what is its confidence interval?
- Who is in the denominator, and how was it estimated?
- Is this measuring disease, detection or service activity?
- How old is the data, and how long is the publication lag for this indicator?
- How many other areas were compared, and would chance explain the ranking?
- Has anything been suppressed or rounded away?
Where the data genuinely earn their keep
None of the above is an argument for ignoring local data. Small-area indicators underpin the weighted capitation formula that allocates NHS funding, the targeting of programmes such as Core20PLUS5, and the audit work that identifies practices whose outcomes differ from those of similar populations. Their proper use is comparative and directional: comparing a place with statistically similar places, looking at trends over several years rather than a single snapshot, and generating questions for local clinicians and Healthwatch rather than answers about individuals.
If you do look up your own neighbourhood, start with the OHID Fingertips profile, download the underlying spreadsheet rather than reading the colour of the map, note the indicator definition, and compare your area with England and with three demographically similar areas. What you will usually find is not a scandal but a pattern: a place shaped by age, work, housing and history. Area data describe places. Clinical care treats people. The gap between the two is where judgement lives.