Sewage as Sentinels: Reading Winter’s Respiratory Signals in UK Wastewater
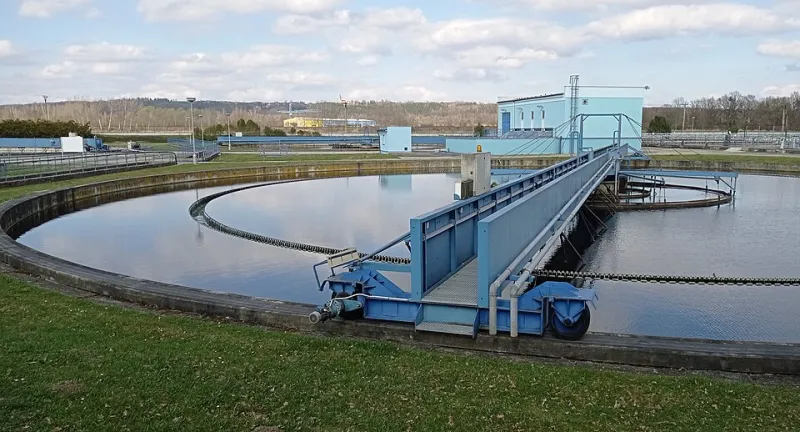
Photo: Czeva, CC BY-SA 4.0, via Wikimedia Commons
As the UK enters the 2026 winter respiratory season, public-health teams are reading two kinds of signal. One comes from clinics, hospitals and laboratories. The other comes from sewage. Wastewater surveillance—sampling effluent at treatment works and testing it for pathogens—has moved from an emergency innovation during the COVID-19 pandemic to a routine part of national intelligence. It can show that influenza, RSV, SARS-CoV-2 or norovirus are circulating before clinical testing climbs. It cannot, on its own, tell us how many people are infected, how ill they will become or whether the NHS will be overwhelmed.
How the sample is made
Most UK wastewater surveillance uses samples from wastewater treatment works. Automated composite samplers collect effluent over 24 hours; some programmes use grab samples. Samples are concentrated in the laboratory, because pathogens are dilute, and then tested by PCR for specific genetic targets. Sequencing can identify variants. Results are normalised—against flow, population equivalent or a faecal marker—so that a rise is not simply a rise in water volume. The UK Health Security Agency, working with the Environment Agency and academic partners, uses wastewater data alongside clinical surveillance. Coverage is broad but not universal: large works cover most of the population, while small works, private treatment systems and septic tanks may be outside the sampling frame.
What a signal can and cannot show
Wastewater is a catchment-level sample, not a random survey of individuals. It can show presence, trend and, with sequencing, the genetic flavour of a pathogen. It can give an early warning because people may shed a virus before they develop symptoms or take a test. For enteric viruses such as norovirus, the link between sewage and community infection is relatively direct. For respiratory viruses, shedding in stool is more variable, so the signal is less easy to translate into human cases. The detection of vaccine-derived poliovirus in London sewage in 2022 showed the method’s potential—and the need for careful follow-up. A wastewater signal is a hypothesis generator, not a verdict.
Why interpretation is tricky
Pathogen shedding differs by organism, age, symptoms and immunity. Clinical testing reflects who is eligible, who seeks care and who is tested, not who is infected. A wastewater rise may precede a hospital rise, coincide with it or fail to appear at all. Normalisation choices can change the shape of a trend. Laboratory methods can change. Storm overflows can dilute samples; industrial discharges and animal sources can confuse some targets. A small catchment can be identifiable, which raises governance questions even when the data are population-level. The result is that wastewater data are most useful when triangulated with GP consultations, hospital admissions, intensive-care occupancy, mortality and local outbreak reports.
From signal to action
Public-health teams do not act on a single wastewater reading. They look for a sustained increase above a baseline, consistency across sites, corroboration from clinical data and a plausible epidemiological picture. Action may be local and modest: a communications push, extra testing, infection-prevention advice or a review of vaccination uptake. In the winter 2026 season, the relevant signals include influenza, RSV, SARS-CoV-2 and norovirus. The value of wastewater is that it can prompt those checks earlier than clinical data alone. The risk is that a noisy signal is over-read as an outbreak.
The limits of looking down the drain
Wastewater surveillance is a public-health tool, not a crystal ball. It cannot identify individuals, measure severity or substitute for clinical surveillance. It depends on coverage, sampling frequency, laboratory capacity and stable methods. It also depends on public trust: population-level data can feel intrusive if their purpose and limits are not explained. For a site interested in digitised disease data, sewage is a useful reminder that not all health data come from patients. Some come from the environment we share. Read carefully, a sample down the drain can tell us that something is changing. It cannot tell us, by itself, what to do.