The Scale Is Not the Suffering: Interpreting Pain Scores in NHS Data
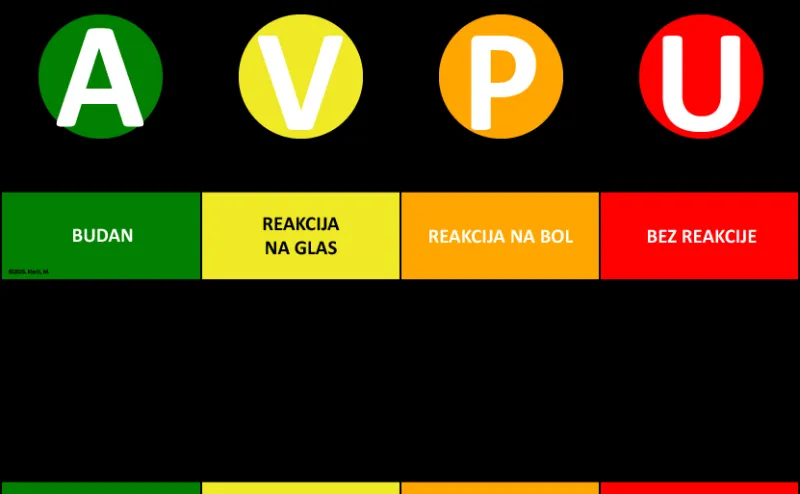
Photo: Minja Klarić, CC BY 4.0, via Wikimedia Commons
Pain is one of the most common reasons people seek NHS care, yet it is also one of the hardest things to record in a structured way. A patient may describe burning, throbbing, stabbing or exhaustion; the record may hold a single integer. Since the late 1990s, clinicians have often been encouraged to treat pain as a fifth vital sign, alongside temperature, pulse, respiration and blood pressure. The intention was humane: to make pain visible, prompt assessment and improve treatment. In 2026, that ambition is embedded in digital systems. Pain scores appear in emergency department templates, inpatient observation charts, community nursing records and general practice coding. The result is a growing body of pain data. The question is what it actually measures.
A number asked for, not a number taken
A pain score is not like a blood pressure reading. It is produced through a conversation. A clinician asks a patient to rate pain on a scale, often from 0 to 10, where 0 is no pain and 10 is the worst pain imaginable. Sometimes a faces scale is used, or a verbal descriptor. The patient translates an experience into a category, and the clinician enters that category into a field. The number is therefore a communication, not a measurement in the physical sense. It is real data, but it is data about a report, not a direct readout of tissue damage. Two patients with the same score may have very different conditions, tolerances and needs. One may be stoical; another may be frightened. A score of 7 does not tell you which.
From bedside form to structured field
Digitisation has made pain scores easier to capture and harder to ignore. In many NHS electronic patient record systems, pain is a mandatory or prompted field in observation sets. That can improve consistency. It can also create false precision. A busy nurse may ask a single question and record the answer without context. A GP may code pain in SNOMED CT as part of a consultation, but the code may not carry the scale used or the patient’s own words. The structured field is useful for audit and safety checks, yet it strips away the qualifiers that make pain meaningful: where it is, what makes it worse, what it feels like, how it affects sleep and movement.
What aggregation can and cannot do
Once pain scores are digital, they can be aggregated. Hospitals can produce dashboards showing average pain scores by ward, time of day or procedure. Analysts can compare before and after an intervention. Researchers can link pain data to prescribing, length of stay or readmission. These uses are legitimate, but they require caution. An average pain score across a ward is a strange statistic. It mixes different scales, different questions and different patients. A rise in average pain may reflect a change in case mix rather than worsening care. A fall may reflect better analgesia, or it may reflect fewer patients being asked. Aggregated pain data can show patterns worth investigating; it cannot, by itself, tell a ward manager whether a patient is suffering.
The missing and the unheard
Pain data is also shaped by who is asked and who is not. Patients with dementia, learning disabilities, delirium or communication differences may not be able to use a numeric scale. They may be recorded as having no pain because no score was obtained, or they may be assessed with a behavioural tool that is not comparable with self-report. Children may use different scales. People who do not speak English may be asked through an interpreter, or not at all. In community settings, pain may be recorded only when it becomes a crisis. These gaps matter. A dataset that appears to show low pain in a particular group may actually show low asking. Before drawing conclusions, analysts should ask about the denominator: who was in the setting, who was assessed, and who was left out.
Using pain data without overclaiming
The most defensible use of pain scores is at the level of the individual encounter, as a prompt for further conversation. A high score should trigger assessment, not just a drug. A low score should not close the conversation if the patient’s behaviour or diagnosis suggests otherwise. At the aggregate level, pain data can support service evaluation and research if it is treated as a signal rather than a verdict. That means documenting the scale used, the timing of the question and the context. It means being transparent about missing data. It means avoiding rankings of wards or trusts based on average pain scores alone. And it means remembering that pain is both a symptom and an experience, and that the second is not fully capturable in a field.
A communication aid, not a verdict
The digitised pain score has real value. It makes pain visible in a record that might otherwise focus on observations and test results. It can prompt action and support audit. But it is not a substitute for listening. In 2026, the NHS holds more pain data than ever before. The task for clinicians, analysts and patients is to read it with the humility it deserves. A number on a scale is a request for help, a shorthand, a starting point. It is not the suffering itself.